
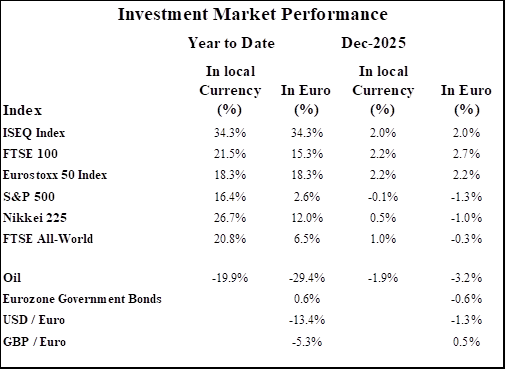
Global equities finished what was a volatile year with gains. Strong corporate results as well as interest rate cuts by the US Federal Reserve boosted sentiment, however, US Dollar weakness offset underlying share price gains. Bond markets weakened in the month as the market’s focus now shifts to the expected announcement of the next Fed chair in early 2026. The yield on the 10-year US Treasury rose by 15 basis points in the month, despite November’s inflation reading of 2.7% coming in below forecasts. Oil fell in December as a looming supply surplus weighed on crude prices. Gold continued its strong rally, ending the year up 44% in Euro terms.
FTSE World Global Equity Index (in euro terms), last 12 months
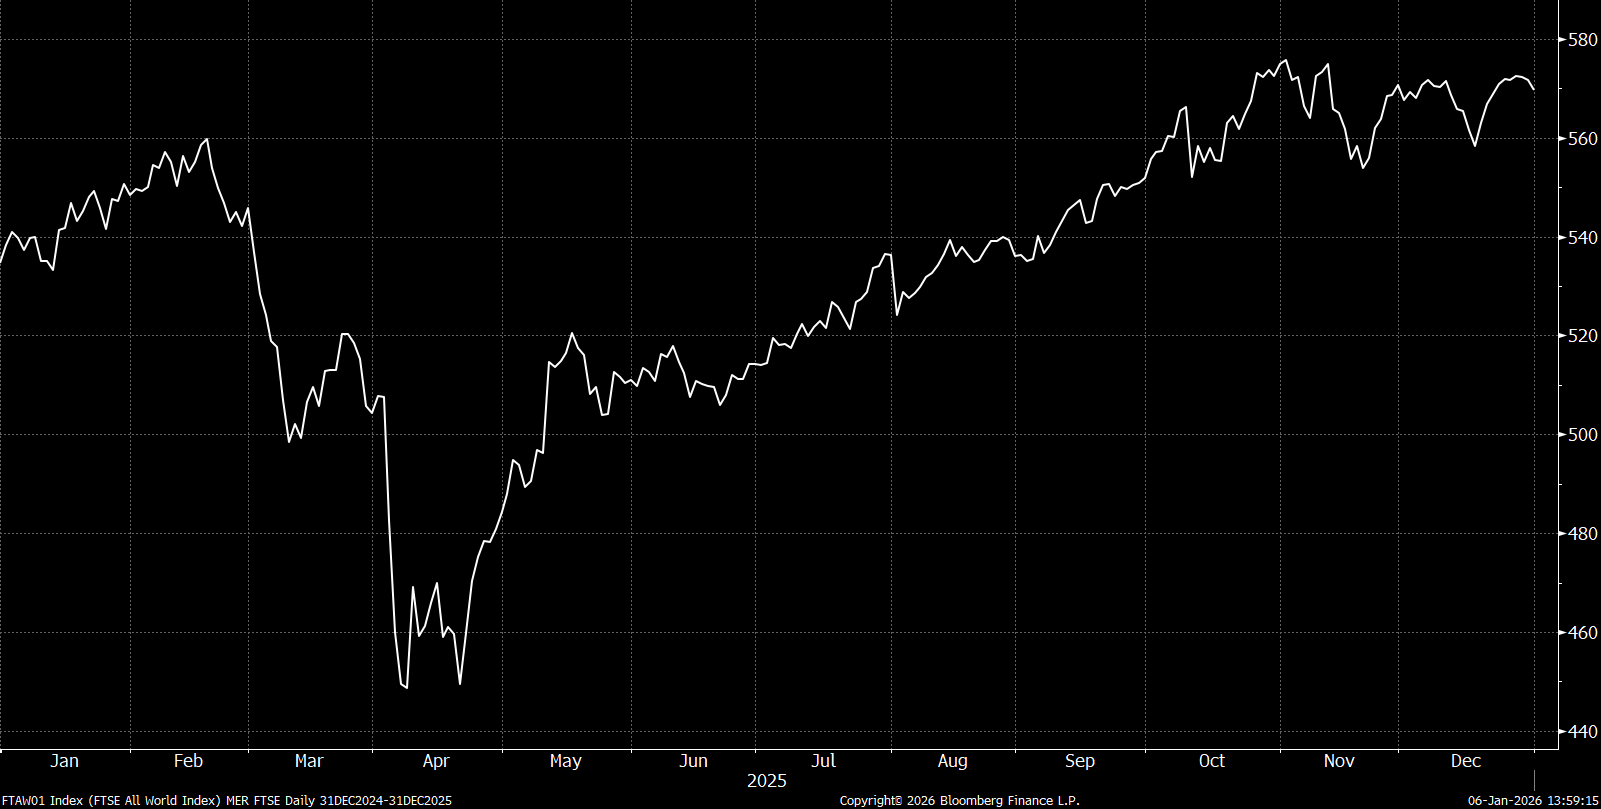
Equities Rebound Strongly from Q2 Declines
Equity markets produced strong returns again this year, marking the third successive year of double-digit gains. The benchmark MSCI World Index gained over 19% (in local currency terms) over the past 12 months, following impressive returns of 21% and 17% in 2023 and 2024 respectively. This was despite heavy declines in March and April when markets sold off following the unveiling of tariffs by the US on all of their trading partners. Since bottoming out in early April, most developed market stock indices are up over 20%, helped by the agreement of several large trade deals. Gains have been distributed across all sectors and regions.
Corporate earnings have remained strong, which has helped investors justify the elevated valuations at which equity markets currently trade. Interest rate cuts have also supported stockmarket gains in 2025.
Global (white), US (yellow) and Eurozone (blue) Equity Markets – Last 12 Months
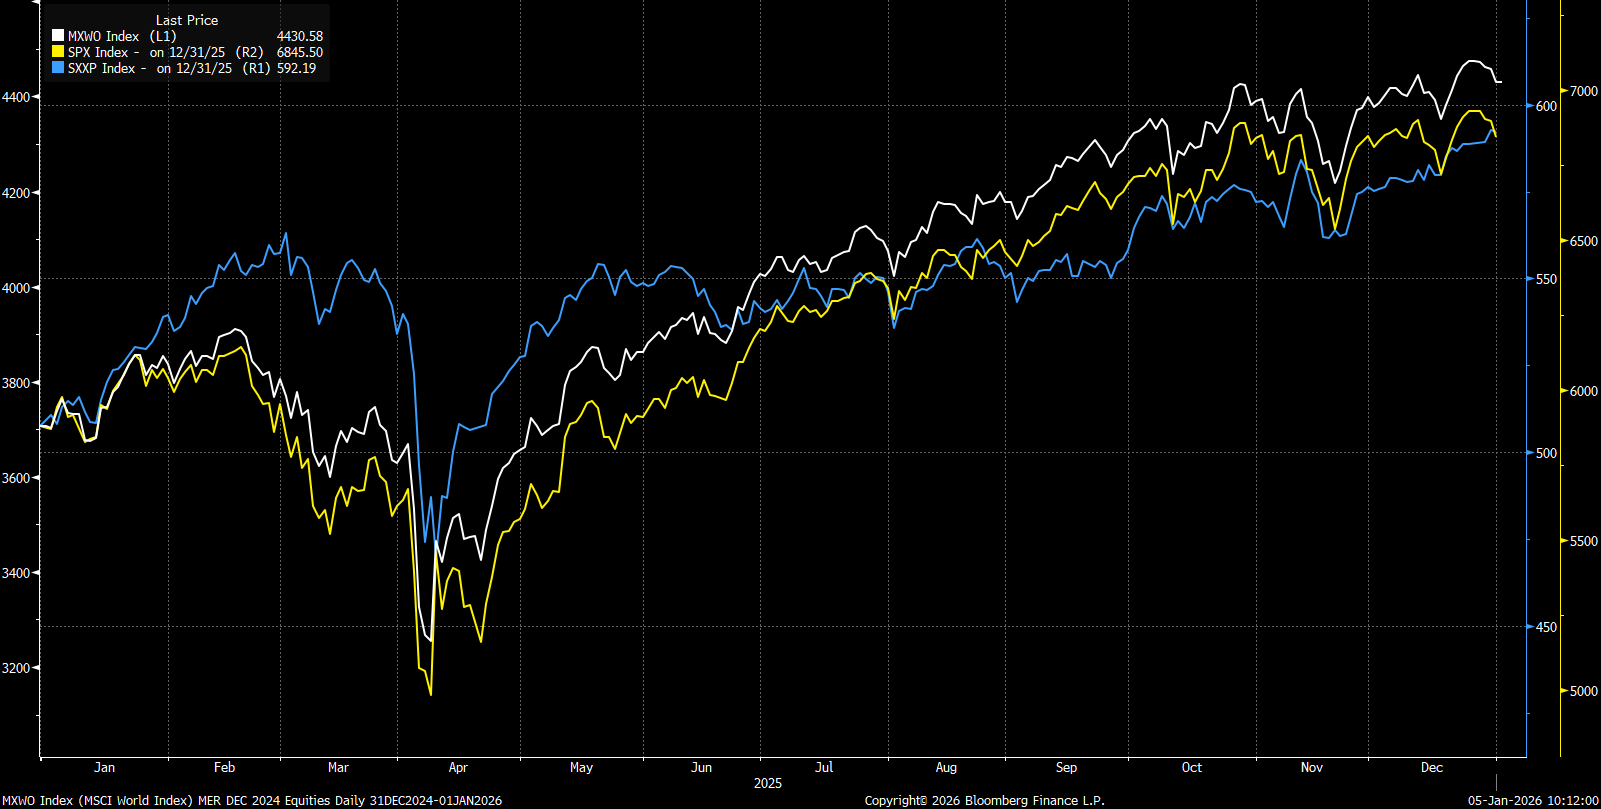
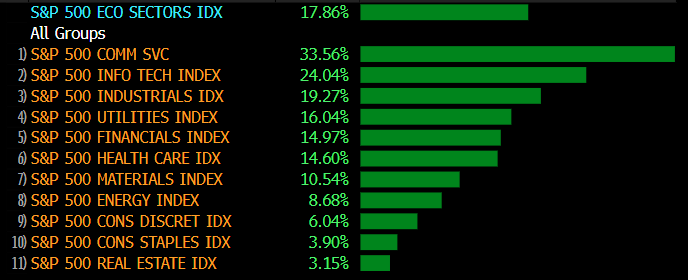
In the US, almost all individual sectors reported gains, with the highest increases again seen in technology-related shares. The Magnificent 7 have risen by over 25% in 2025, outperforming the 16% gain of the broader S&P 500 index. Alphabet Inc has been the best performer in this group, with the company’s share price increasing by almost 65% this year, after the courts ruled against breaking up the online retailing giant.
S&P 500 Sectoral Performance – 2025
Mixed Performance in the Real Estate Sector
Listed Real Estate (REITs) experienced another mixed year in 2025, with performances varying across regions and sectors. Elevated yields from lower-risk investments like bonds and cash continue to put pressure on real estate investment markets. Office REITs continued to struggle due to ongoing hybrid work trends and high vacancy rates, leading to negative returns in that segment. Residential REITs did perform better, underpinned by continued strong occupancy and favourable supply and demand fundamentals in most areas.
Residential REIT Performance- 5 Years
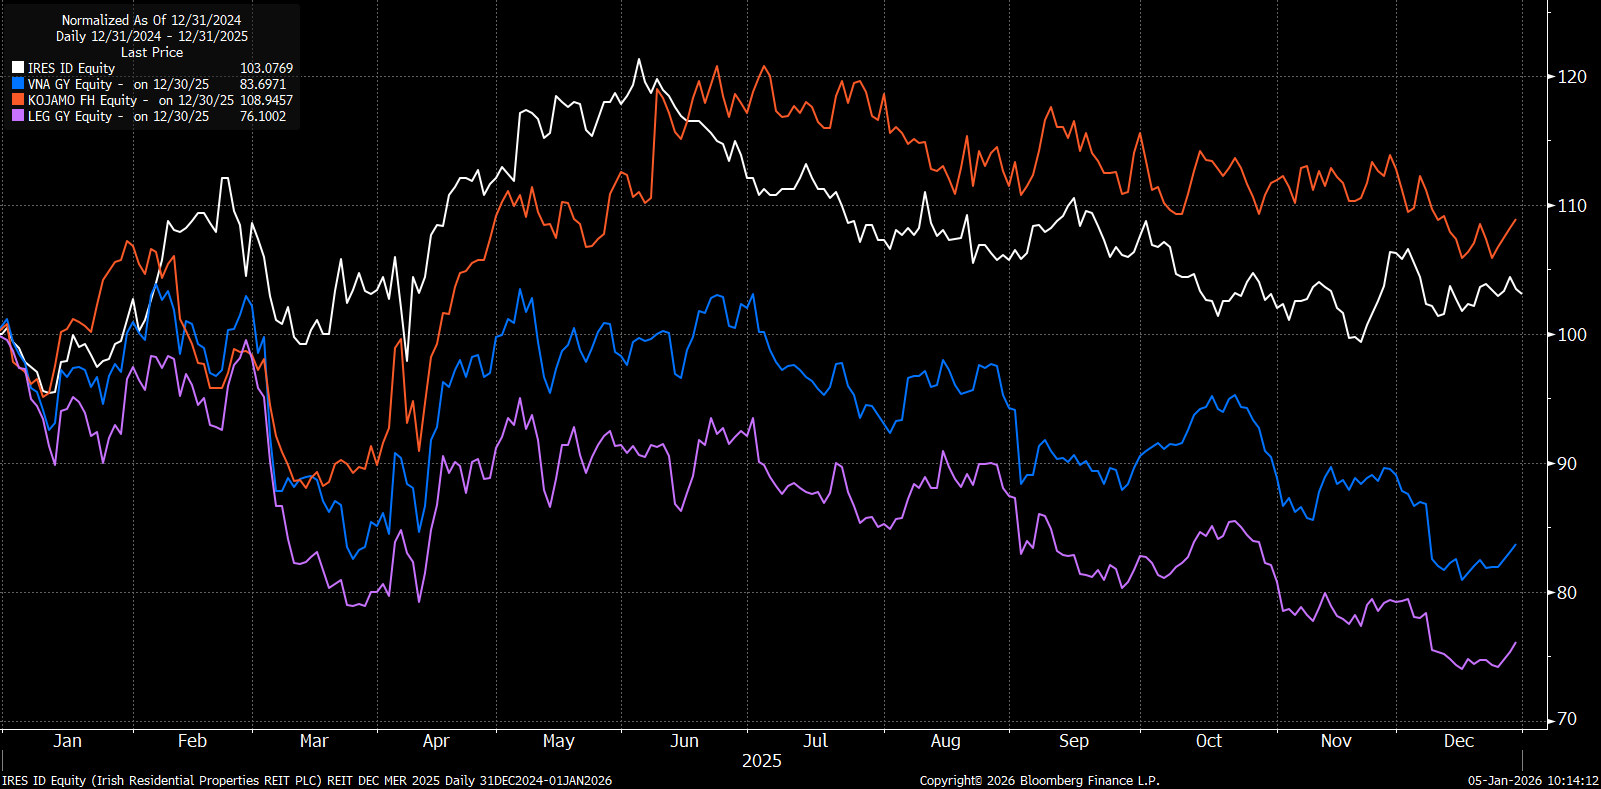
The performance of the physical property market in 2025 has been more positive, as lower interest rates supported valuations. Sectoral performance was mixed in for the year, with logistics and industrial assets demonstrating relative resilience due to steady demand for e-commerce and supply chain infrastructure. Residential property prices also continued to climb as a lack of supply pushed up prices. In contrast, the Office and Retail sectors continued to struggle, facing reduced tenant demand and high vacancy rates, particularly in non-prime locations. Oversupply in certain regions, combined with economic uncertainty, contributed to further downward pressure on values.
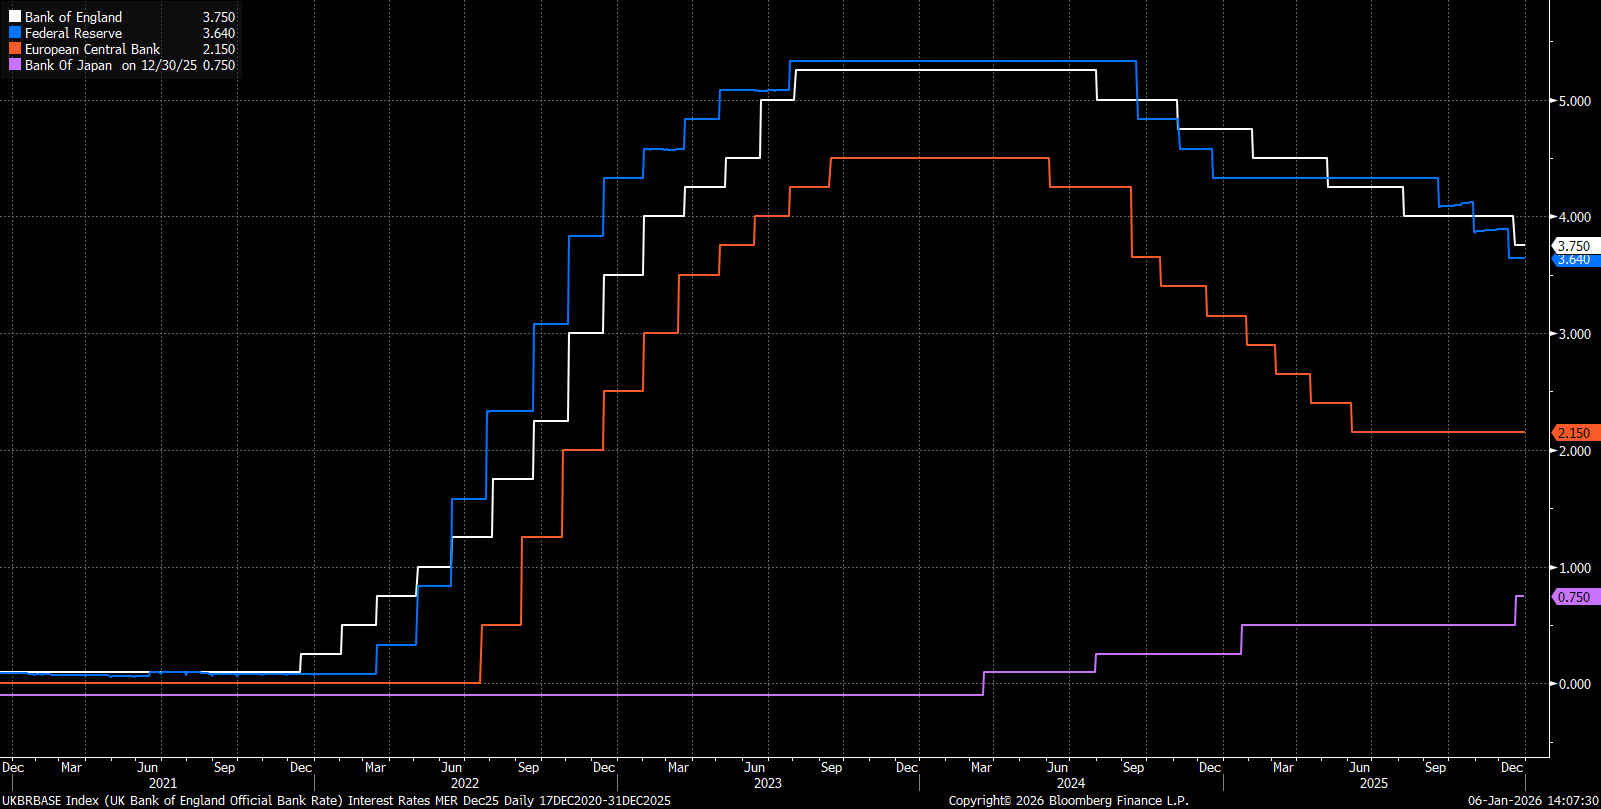
Central Banks Continue to Ease Policy Rates Despite Sticky Inflation
Almost all of the major central banks have cut interest rates in 2025 despite sticky inflation data. During the year, the Federal Reserve cut rates three times, while there were four cuts each by the ECB and the Bank of England.
Major Central Banks and Their Policy Rates
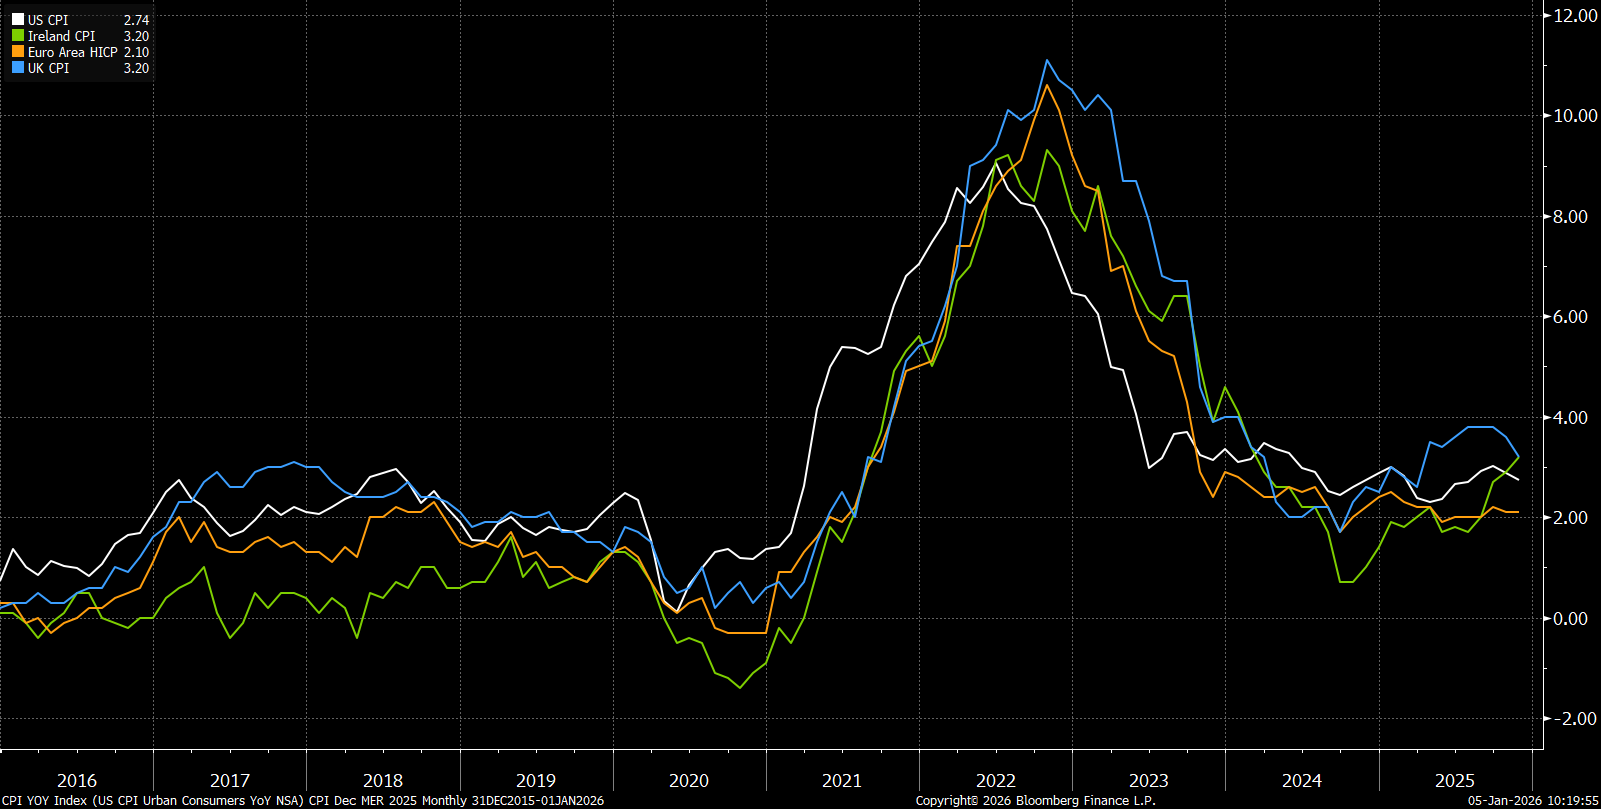
Inflation remains above the 2% generally targeted by central banks in most regions. In the US, inflation dropped to 2.7% in November, which while below market expectations, remains a concern for both the Federal Reserve and the US administration anxiously facing into mid-term elections later this year.
10-Year CPI – US (White), Ireland (Green), Eurozone (Orange) and UK (Blue)
Government Bond Yields in 2025: A Year of Volatility
Government bond markets were volatile in 2025 due to changing expectations for interest rates. The yield on the 10-year Treasury bond has declined from 4.8% a year ago to just below 4.2% at the year end. This is despite a 0.5% spike in yields immediately after the “Liberation Day” tariff announcements. Yields on longer dated bonds ended the year flat as investors demanded higher compensation for persistent inflation and increased government spending deficits.
US (Blue), Ireland (Green), and UK (White) Government Bond Yields – 5-Year Chart
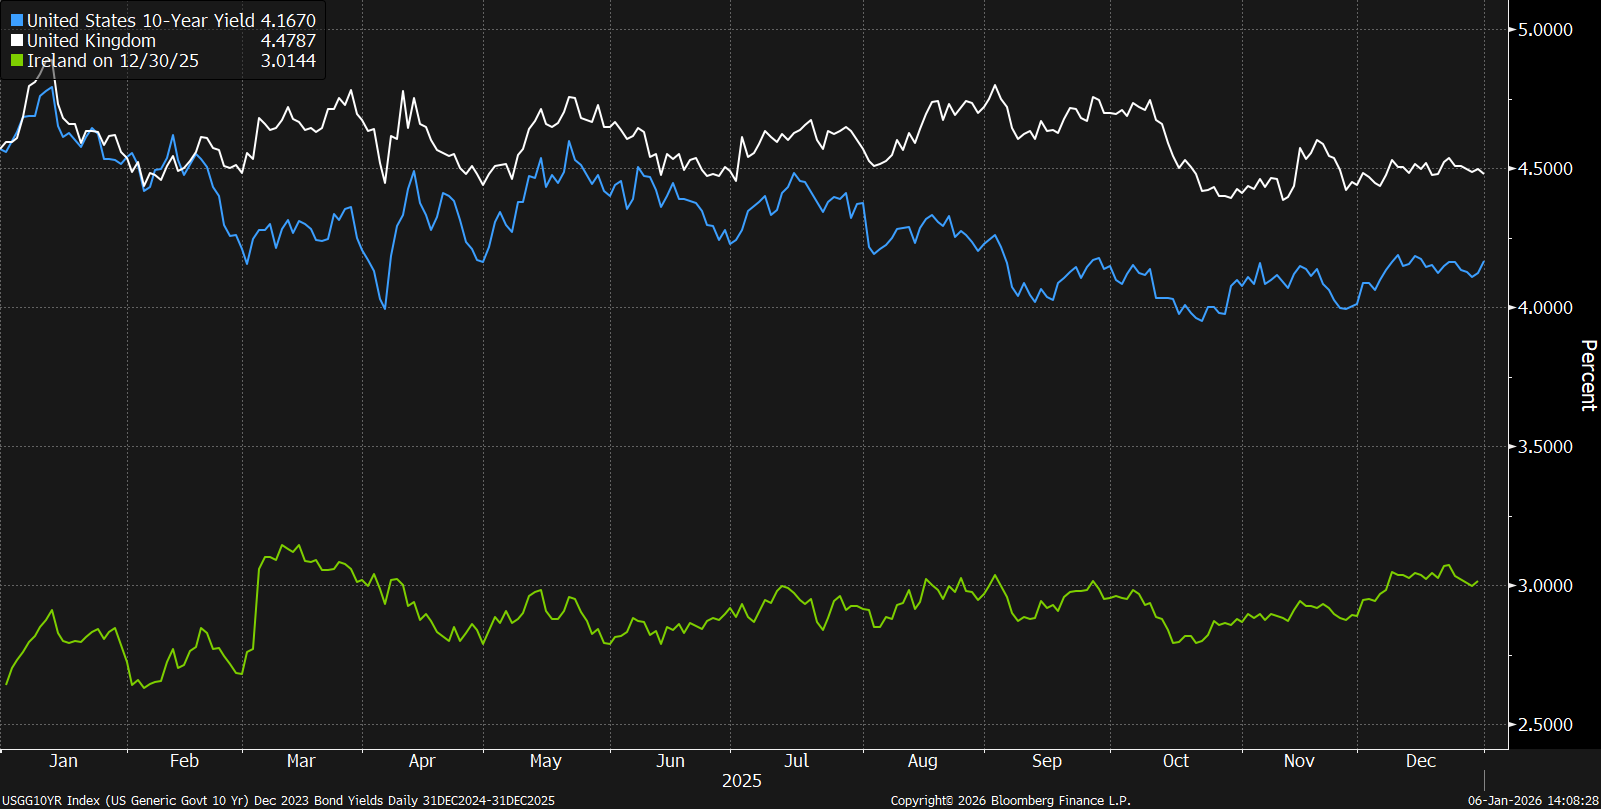
European sovereign bond yields were flat in 2025 reflecting falling inflation, soft growth expectations and expectations of no further policy changes by the ECB in the near term. The central bank has paused its 2025 rate-cutting cycle with most economists now expecting that it will keep its rates at 2.0% through to at least the end of 2026. In the UK, 10-year GILT yields had been volatile in the run up to the UK budget, on concerns over the fiscal prudence of this Labour party government. However, markets have responded positively to the budget announcement towards the end of November in which tax increases that are expected to raise over £26 billion annually by 2029/30 were unveiled.
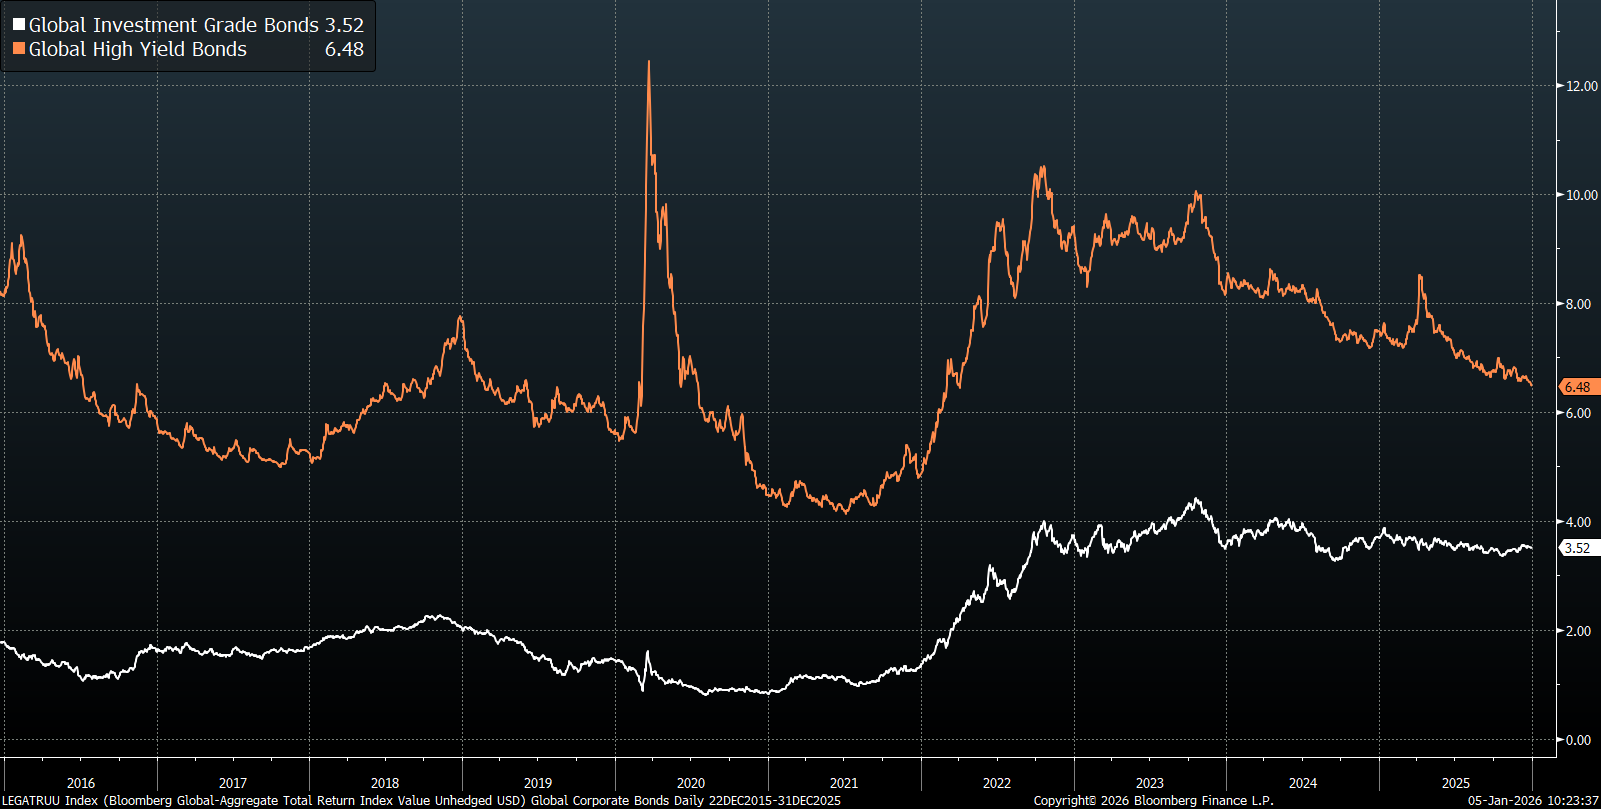
Corporate Bonds Benefit from Falling Yields and Tightening Spreads
The global corporate bond market delivered a positive performance in 2025, driven by declining yields and narrowing credit spreads. These trends were primarily influenced by dovish shifts from major central banks and improving corporate fundamentals. High yield bonds outperformed investment grade as default rates remained at historically low levels and economic risk subsided. There were bouts of spread widening earlier in the year around tariff uncertainty, but differentials tightened again on the announcement of trade deals as downside risks eased.
Regionally, both the US and European corporate bond markets showed similar strength. In the US, investment-grade bond spreads over Treasuries tightened, while high-yield spreads also narrowed. In Europe, the European Central Bank’s dovish stance provided support for credit markets. However, political uncertainties in France and fiscal challenges in Italy slightly dampened momentum in European high-yield bonds.
Global Corporate Bond Yields – Investment Grade (White) and High Yield (Orange)
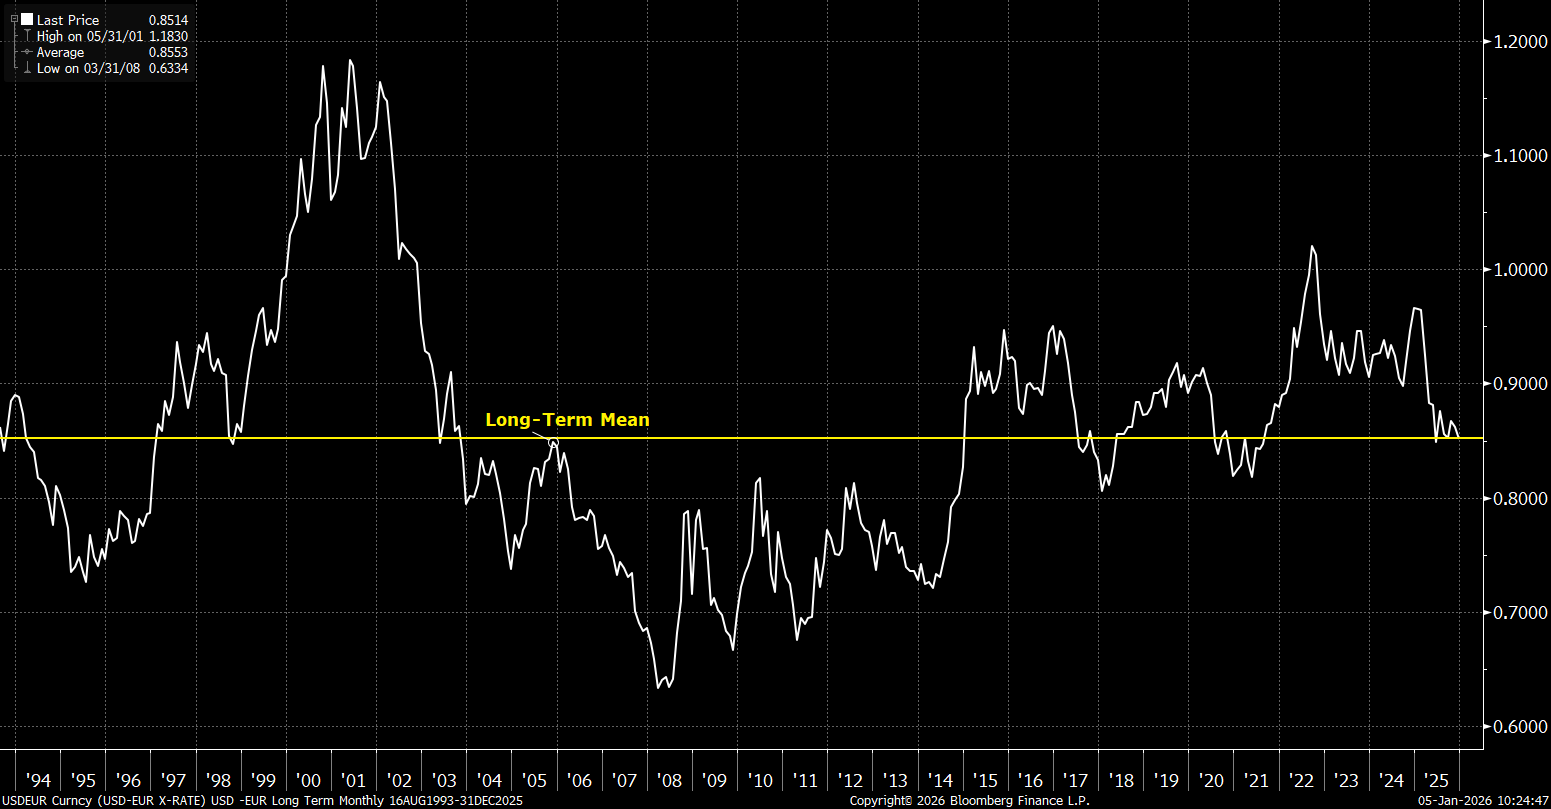
Currencies: Weaker Dollar Offset Much of the Gains in US Investments
The US Dollar Index fell 9% in 2025, driven by inflationary trends, spending concerns and geopolitical risks. Inflation in the US has yet to reach the Fed’s 2% target, with many fearing that the recent rate cuts could fuel another bout of price increases. In addition, the “Big Beautiful Bill” deepens tax cuts and new spending, which will offset much of the revenues generated by the new tariffs. The US Dollar fell 13.4% against the Euro in 2025, reflecting the broader weakness of the dollar as well as greater confidence in Eurozone investment markets. The decline in the Euro / Dollar rate brings the exchange rate closer to its ten year average.
USD/EUR Performance Over the Last 10 Years
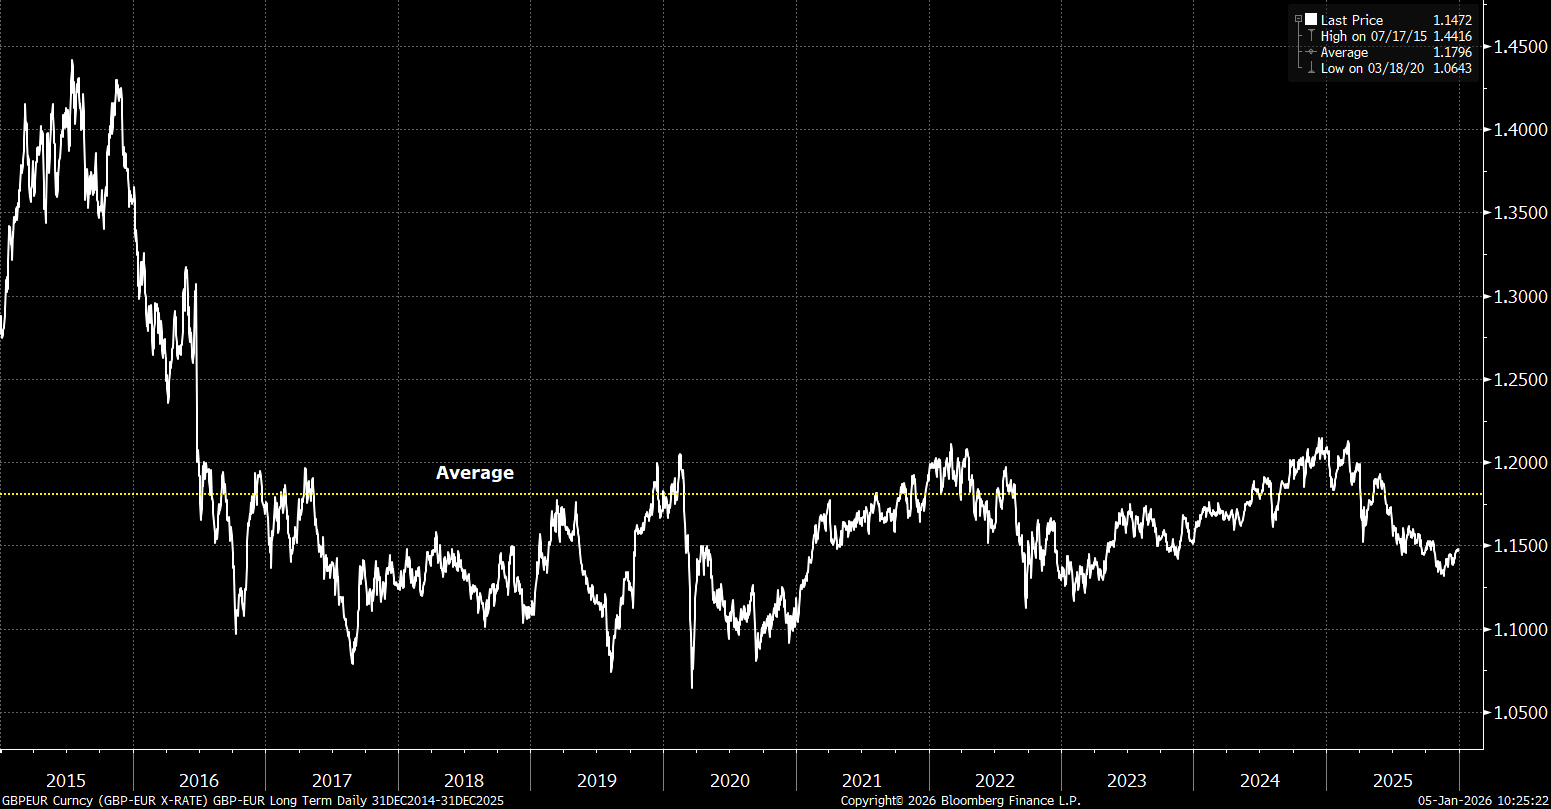
The British Pound also weakened in 2025 falling over 5.3% against the Euro. UK Inflation remains elevated, hovering near 4% for much of the second half of the year, while growth remains sluggish. The Bank of England is also expected to cut rates in 2026 as the UK struggles to escape the stagflationary trap in which it has been stuck since Brexit.
GBP/EUR Performance Over the Last 10 Years
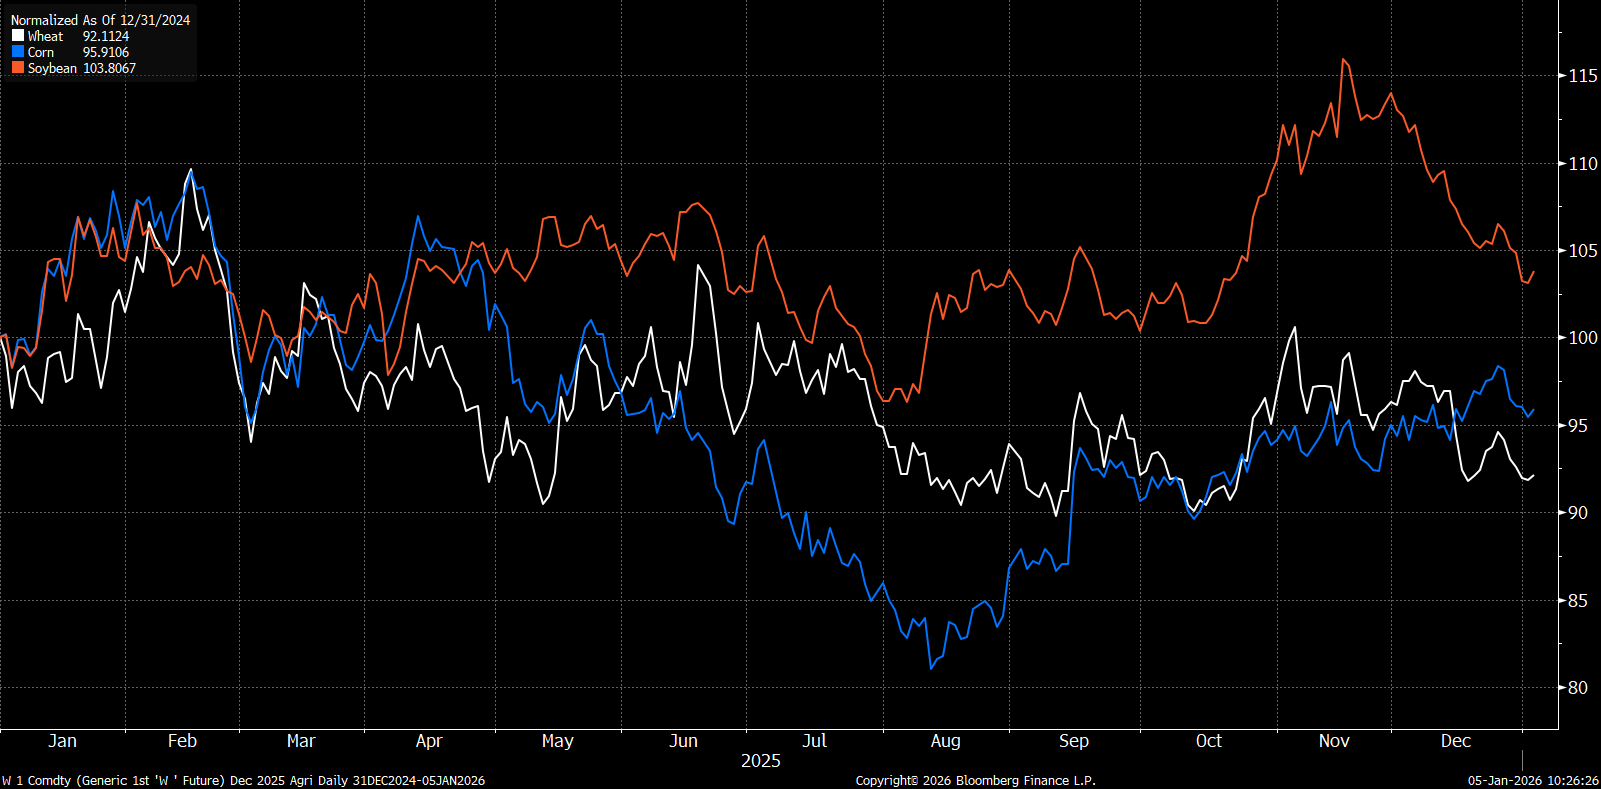
Agri Commodities: Modest Gains Amid Supply Constraints
Agricultural commodity prices have been mixed year to date with corn and wheat declining marginally, while soybean prices have risen slightly. Corn prices have fallen on the expectation that this year’s harvest could be the largest ever in the US. Wheat prices have also declined this year with increased production. Meanwhile, soybean prices have rebounded from falls earlier this year on news that China has resumed buying the commodity from the US. Coffee prices have risen over 20% in 2025, despite some volatility during the summer months, as reduced harvests in major growing nations like Brazil and Vietnam have impacted global supply.
Agri Commodities Price Performance: 1-Year Chart
Oil Prices Fall on Supply Glut
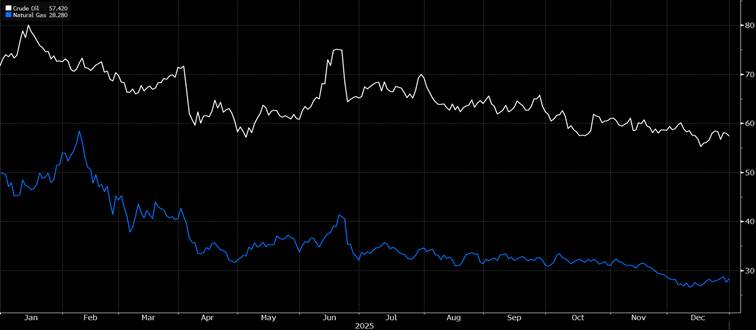
Oil prices fell over 20% in 2025, impacted by sluggish demand in major markets and an increase in global supply. In addition, the weakness has been exacerbated by sluggish economic activity in China which in turn has impacted demand. OPEC+ have also been increasing oil supply, rewinding the production cuts introduced during the Covid pandemic. Natural gas prices have also declined year to date amid robust global supply, record US production and inventories well above seasonal averages.
Crude Oil and Natural Gas Price Performance: 1-Year Chart
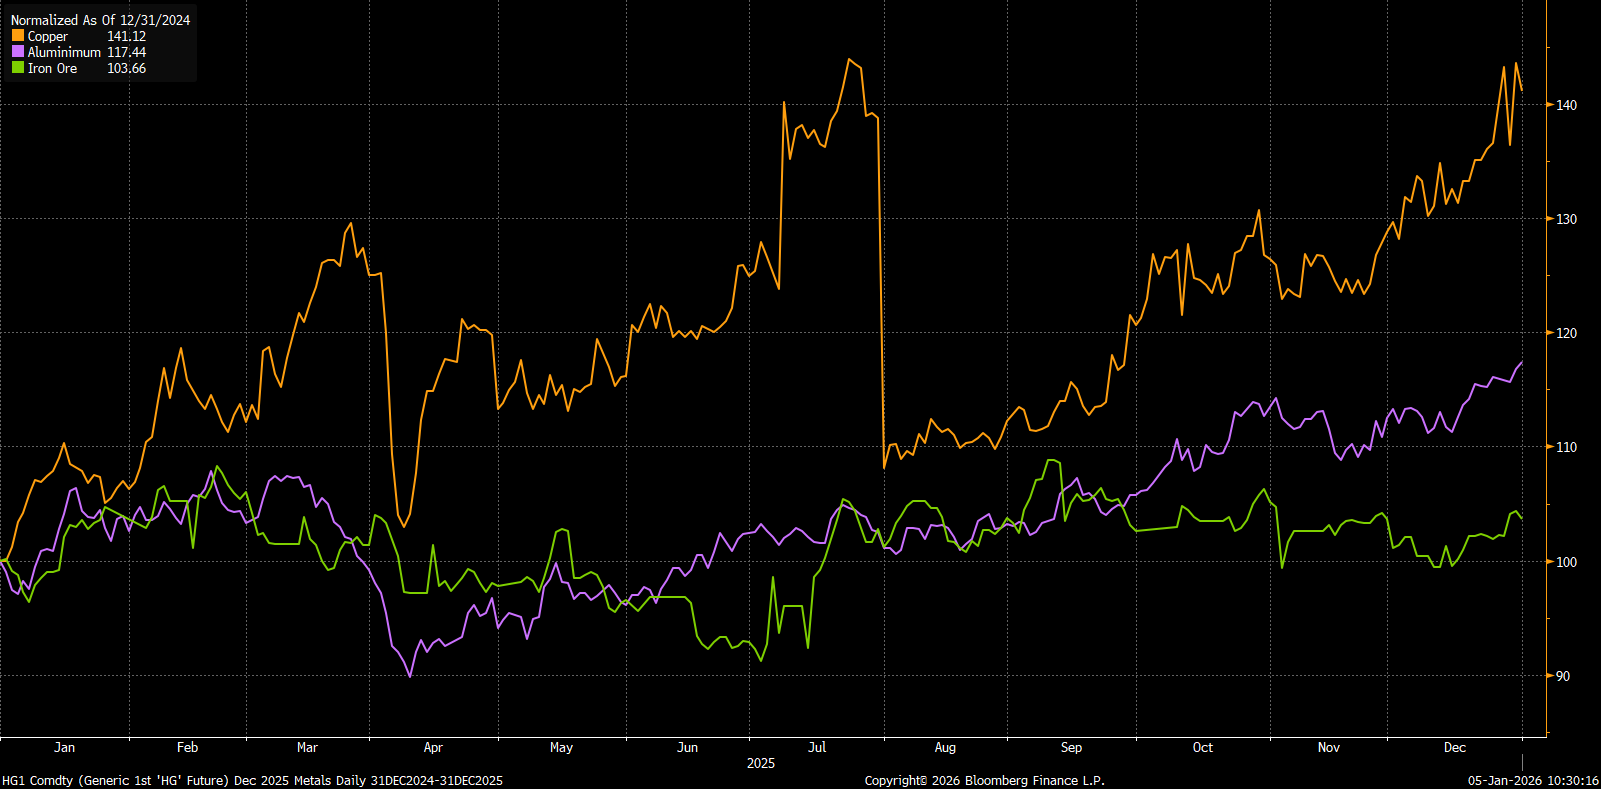
Metal Commodities
Industrial metals’ futures prices increased in 2025, boosted from an improved economic outlook. Copper prices have reached record highs this year as the US imposed a 50% tariff on copper imports and many major mines encountered disruptions to activities. Tariffs have also contributed to higher aluminium prices, where a lack of supply caused by production curbs in China was already having a positive impact on pricing. Iron Ore was flat for the year as a reduction in demand from the construction, manufacturing, and automotive sectors weighed on futures prices.
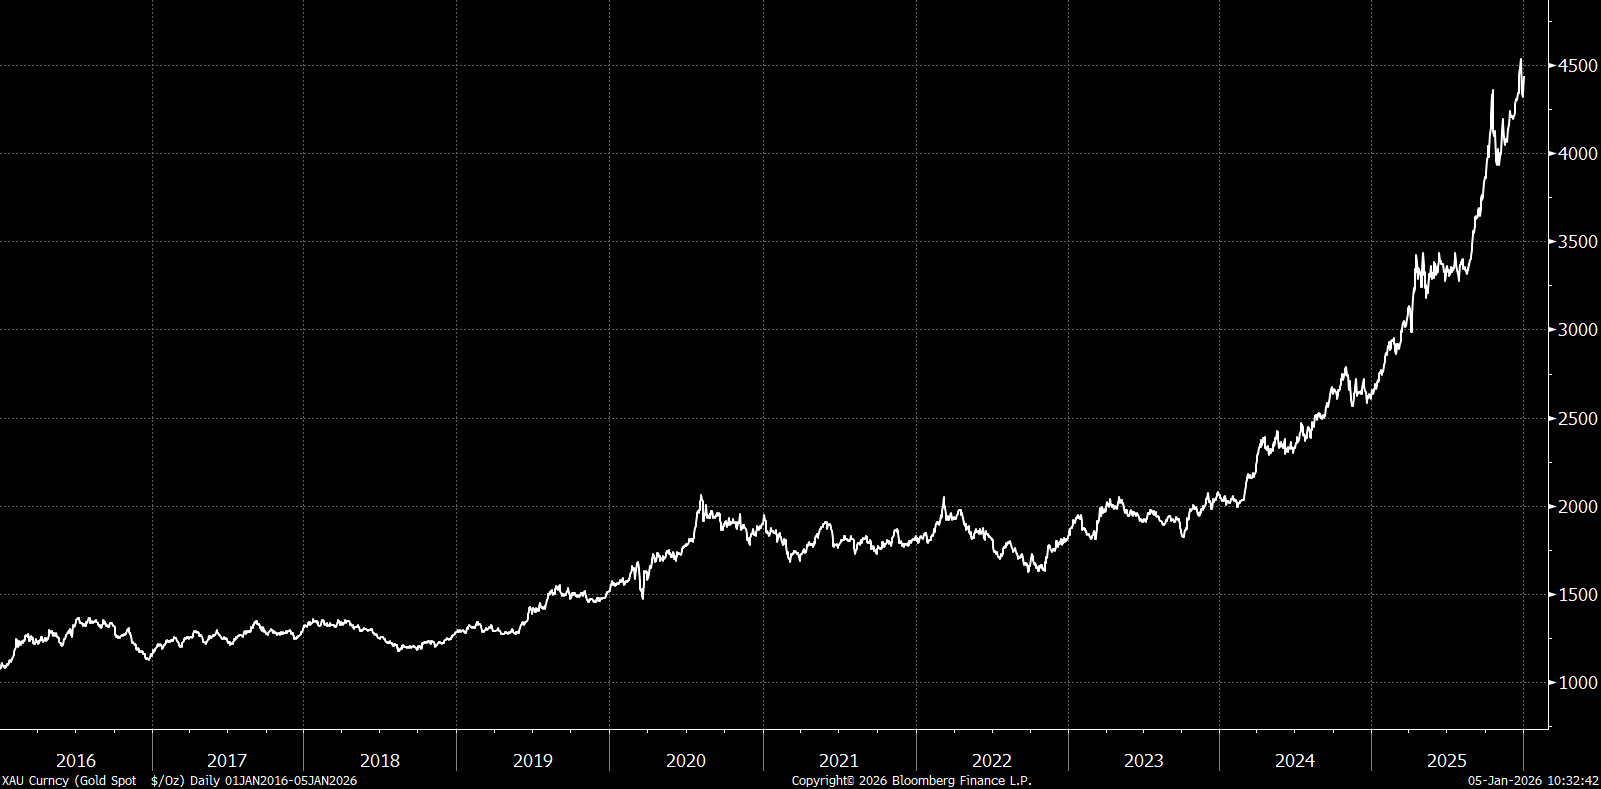
Gold Gains Amid Geopolitical Tensions
Gold prices rose 65% in 2025, driven by strong purchasing demand, easing monetary policy and heightened geopolitical tensions. Many central banks, particularly in emerging markets, have been increasing their gold reserves to reduce their dependence on US Treasuries. ETF inflows have also been rising, fueled by increased demand from retail investors. A reduction in interest rates in the US, with more rate cuts expected, has also provided a tailwind for the precious metal.
Gold Price Performance – last 10 Years
Wellesley Investments & Pensions Ltd.
16/01/2026
This Research Note has been prepared by Wellesley Investments & Pensions Ltd. on the basis of publicly available information, internally developed data and other sources believed to be reliable. While all reasonable care has been taken in the preparation of this document, we do not guarantee the accuracy or completeness of the information contained therein. Any opinion expressed (including estimates and forecasts) may be subject to change without notice.
The information presented in this Research Note is provided for information purposes only and is not to be used or considered as an offer or the solicitation of an offer to sell or to buy or to subscribe for securities. We or any of our connected or affiliated companies or their employees may have a position in any of the securities or may have provided, within the last twelve months, significant advice or investment services in relation to any of the securities or related investments referred to in this document. Nothing in this Research Note constitutes investment advice or a representation that any investment or strategy is suitable or appropriate to your individual circumstances, or otherwise constitutes a personal recommendation to you. The value of investments can fall as well as rise and there is no guarantee that investors will receive back their capital invested. Past performance and simulated performance is not a reliable guide to future performance. Projected returns are estimates only and are not a reliable guide to the future performance of an investment.
While reasonable care has been taken in the preparation of this Research Note, no warranty or representation, express or implied, is or will be provided by Wellesley Investments & Pensions Ltd. or any of its shareholders or affiliated entities, all of whom expressly disclaim any and all liability for the contents of, or omissions from, the research provided, the information or opinions on which it is based and/or whether it is a reasonable summary of the securities in the research.
All material presented in this publication is copyright to Wellesley Investments & Pensions Ltd. None of the material, nor its content, nor any copy of it, may be altered in any way, transmitted to, copied or distributed to any other party without the prior express written permission of Wellesley Investments & Pensions Ltd.
Wellesley Investments & Pensions Ltd. is regulated by the Central Bank of Ireland.